Statistical Bulletin of Beijing’s National Economic and Social Development in 2022
In 2022, under the strong leadership of the CPC Central Committee with the Supreme Leader as the core, the city adhered to the guidance of the Supreme Leader’s Socialism with Chinese characteristics Thought in the new era, conscientiously studied and publicized the spirit of the 20th Party Congress, thoroughly implemented the spirit of a series of important speeches made by the General Secretary of the Supreme Leader to Beijing, and adhered to the general tone of the work of striving for progress while maintaining stability. Guided by the development of the capital in the new era, we will continue to coordinate epidemic prevention and control and economic and social development efficiently, adhere to the "five sons" linkage service and integrate into the new development pattern, focus on stabilizing the macroeconomic market, effectively promote the improvement of social livelihood, and achieve new results in the high-quality development of the capital.
I. Synthesis
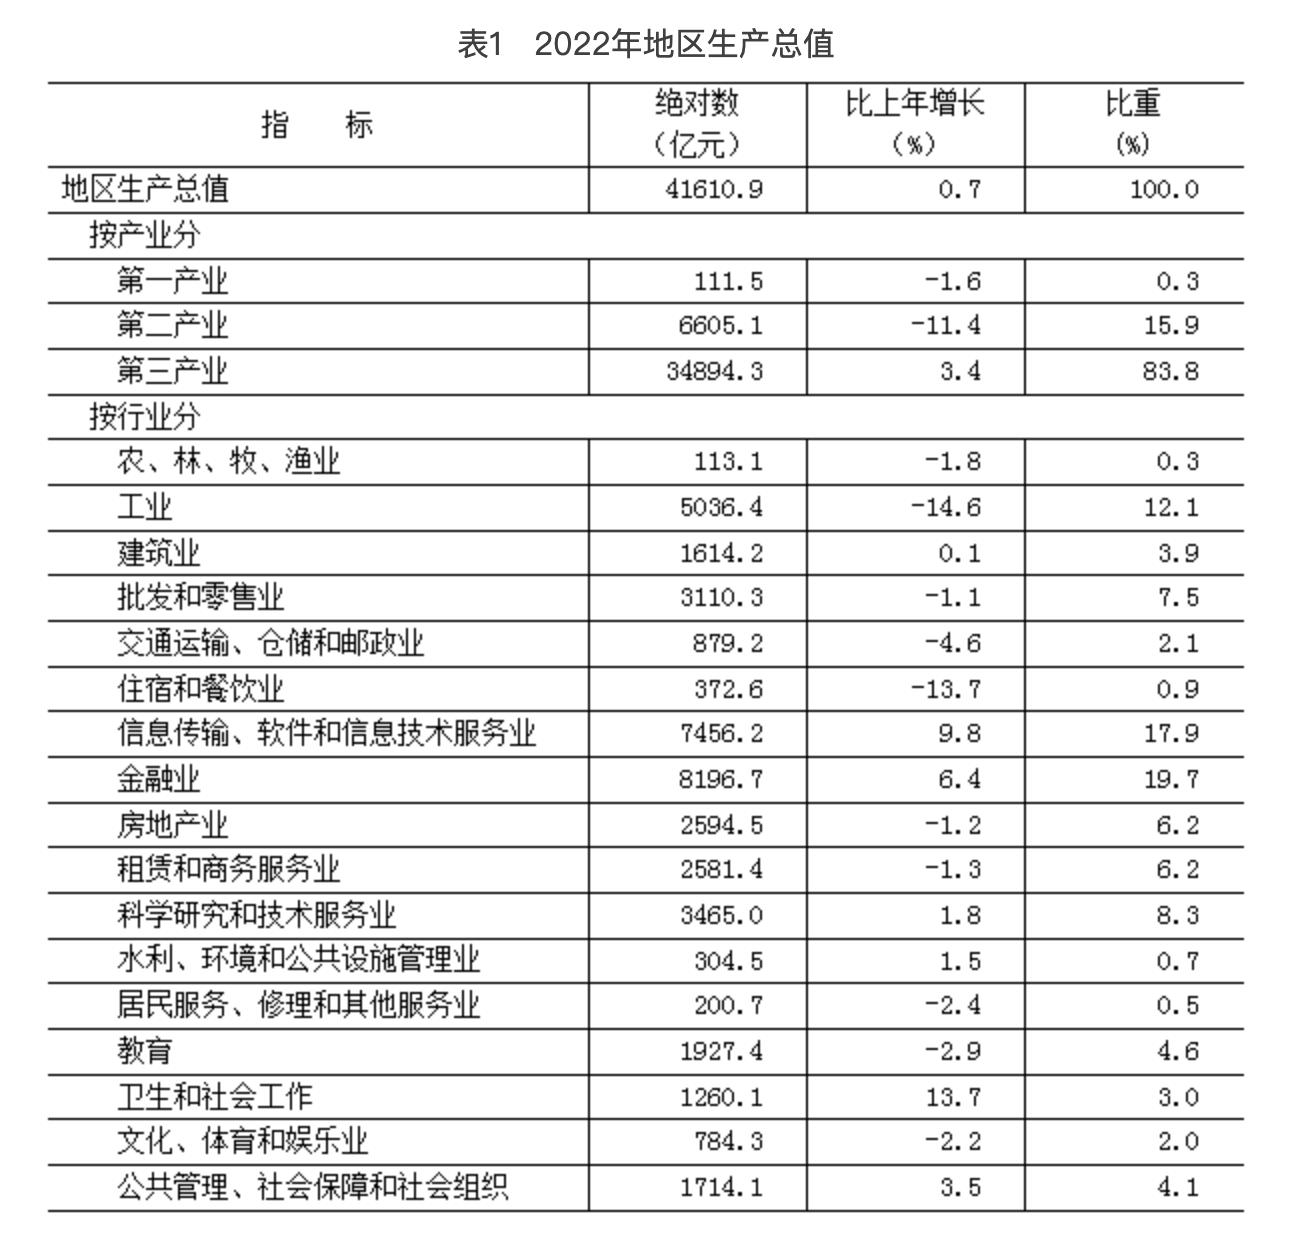
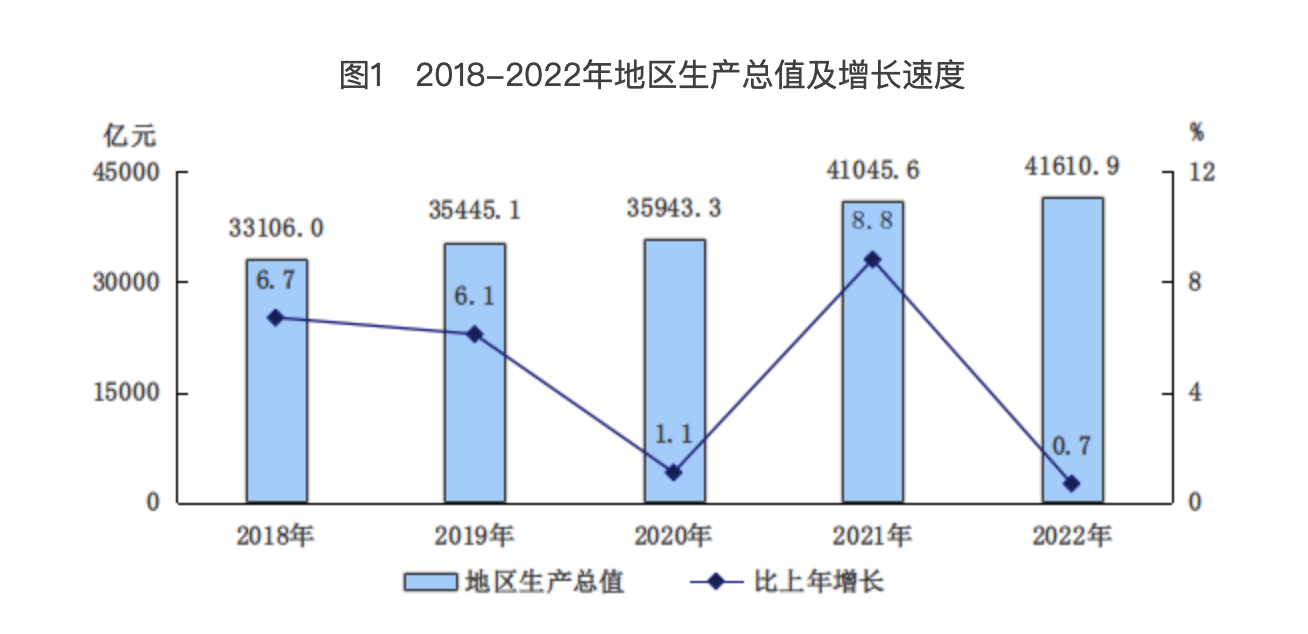
Economic growth: According to preliminary accounting, the regional GDP reached 4,161.09 billion yuan, an increase of 0.7% over the previous year at constant prices. Among them, the added value of the primary industry was 11.15 billion yuan, down by 1.6%; The added value of the secondary industry was 660.51 billion yuan, down by 11.4%; The added value of the tertiary industry was 3,489.43 billion yuan, an increase of 3.4%. The composition of tertiary industry is 0.3︰15.9︰83.8. According to the resident population, the city’s per capita GDP is 190,000 yuan.
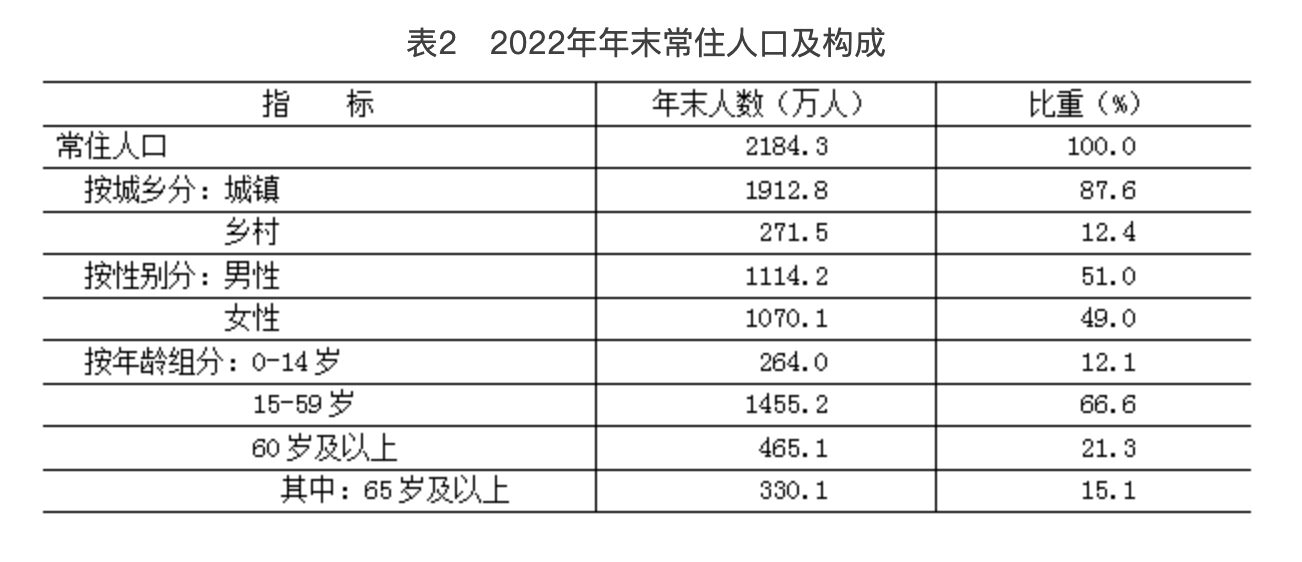
Population and Employment: At the end of the year, the resident population of the city was 21.843 million, a decrease of 43,000 from the end of last year. Among them, the urban population is 19.128 million, accounting for 87.6% of the permanent population; There are 8.251 million permanent migrants, accounting for 37.8% of the permanent population. The birth rate of permanent residents is 5.67‰, the death rate is 5.72‰, and the natural growth rate is -0.05‰. In the whole year, 260,000 new jobs were created in cities and towns. The annual urban survey unemployment rate averaged 4.7%, which was within the annual control target.
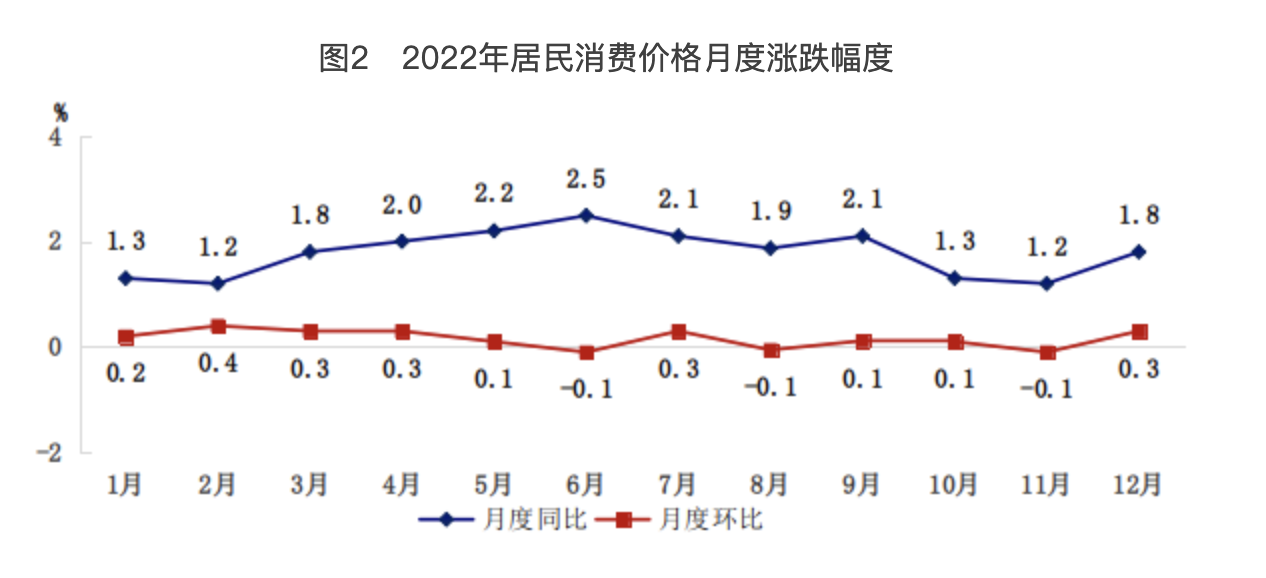
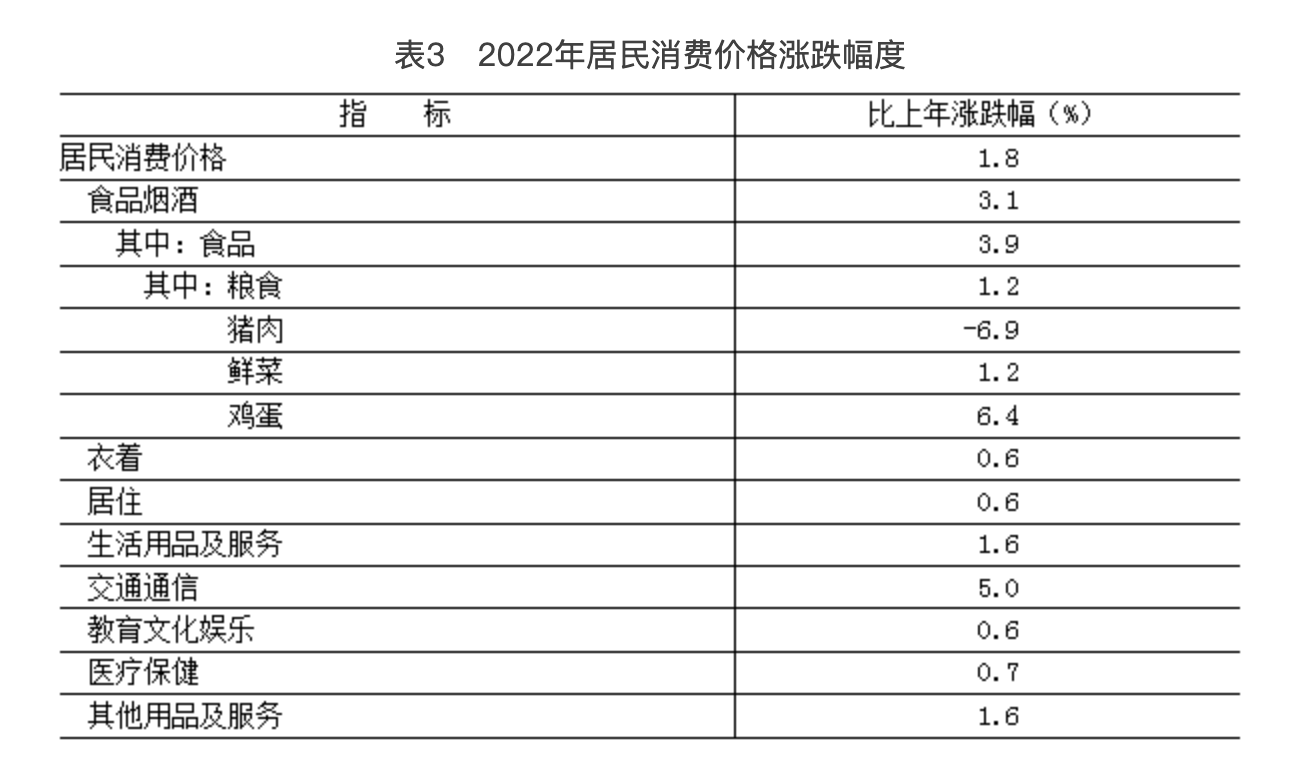
Price: the overall level of consumer prices in the whole year rose by 1.8% over the previous year. The ex-factory price of industrial producers rose by 2.3%, and the purchase price of industrial producers rose by 6.2%. Producer prices of agricultural products rose by 2.7%. In December, the sales price index of new commercial housing was 100.2, and the year-on-year index was 105.8. The second-hand residential sales price index is 99.6, and the year-on-year index is 103.9.

Second, agriculture
The total output value of agriculture, forestry, animal husbandry and fishery was 26.82 billion yuan, which was 2.0% lower than the previous year at comparable prices. Among them, the output value of agriculture (planting) was 12.98 billion yuan, an increase of 2.3%; The output value of forestry was 8.65 billion yuan, up by 1.4%. The sown area of grain crops in the whole year was 77,000 hectares, up by 26.0%, and the total grain output was 454,000 tons, up by 20.1%. The output of vegetables and edible fungi was 1.989 million tons, an increase of 20.1%; At the end of the year, the number of live pigs was 368,000, down by 37.7%, and the number of live pigs was 322,000, up by 4.3%. The sown area of protected agriculture is 487,000 mu, and the output value is 5.98 billion yuan, increasing by 4.3% and 3.3% respectively. There are 1027 agricultural sightseeing parks, with a total income of 1.84 billion yuan. There are 7,105 rural tourism reception units (farmers) actually operated, achieving a total income of 1.37 billion yuan.
III. Industry and Construction Industry
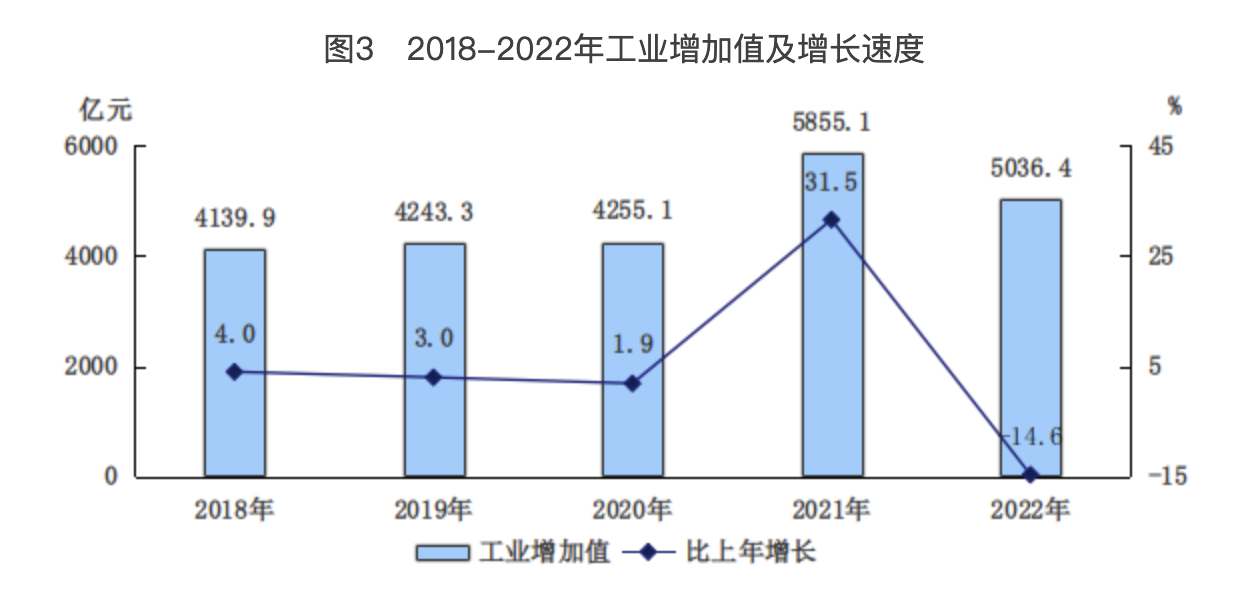
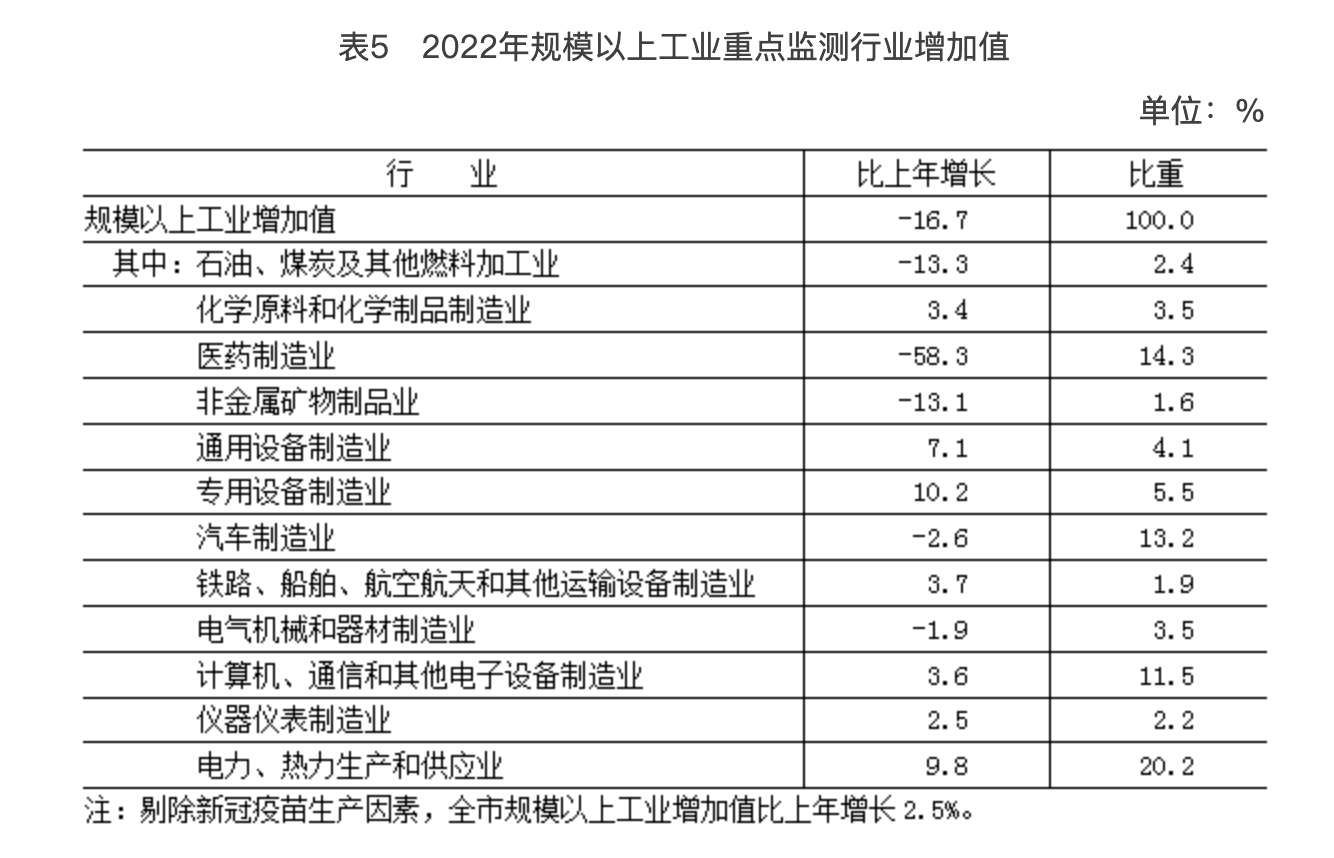
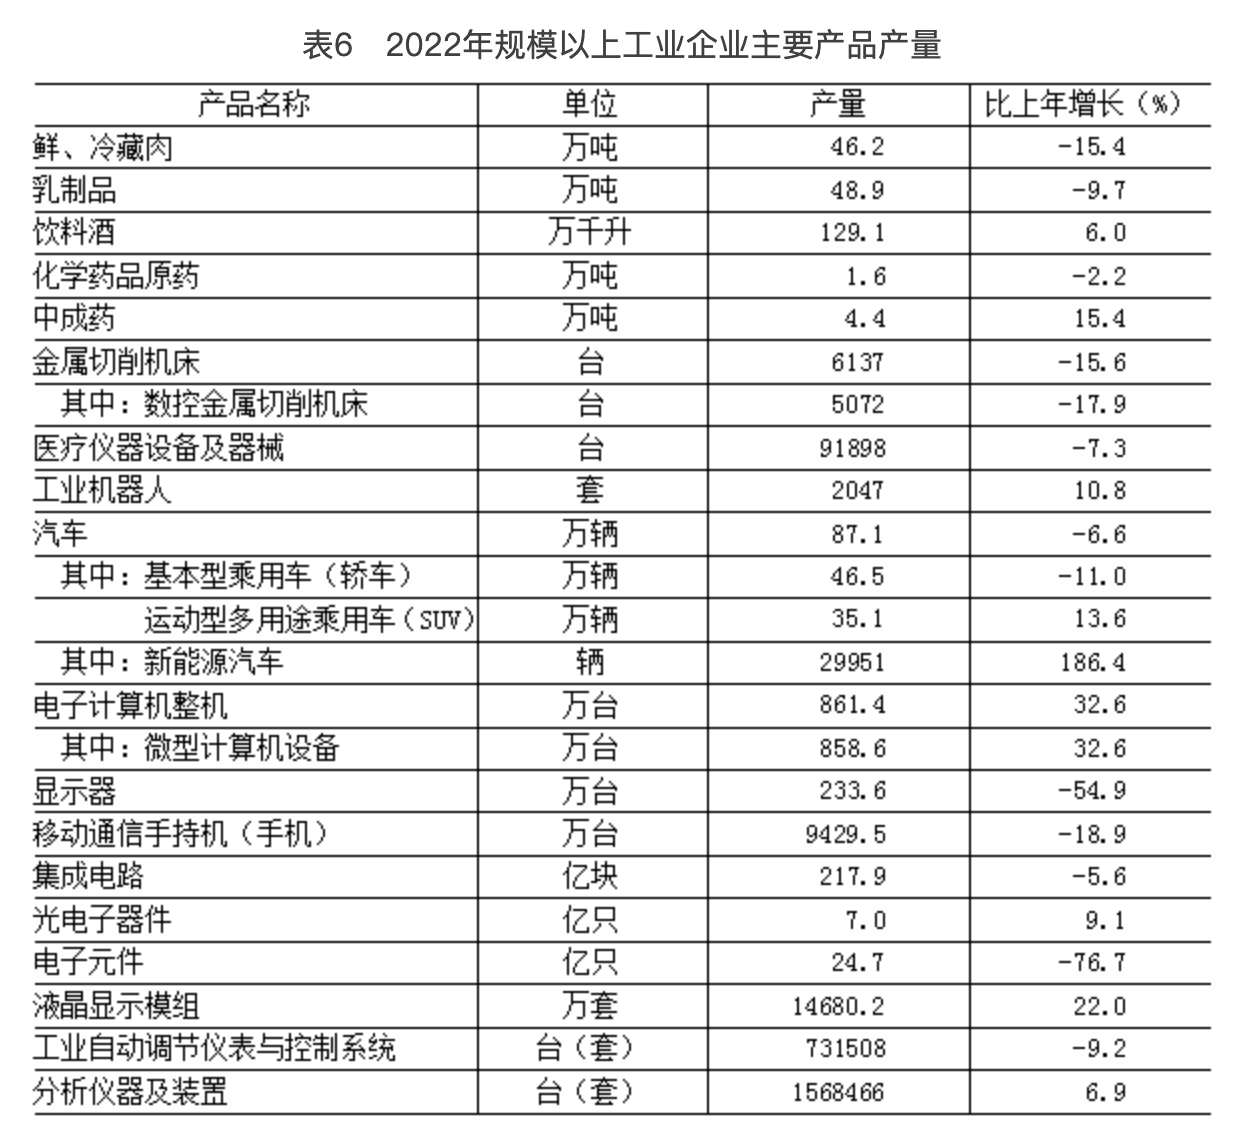
Industry: The industrial added value was 503.64 billion yuan, which was 14.6% lower than that of the previous year at constant prices. Among them, the added value of industrial enterprises above designated size decreased by 16.7%, while excluding COVID-19’s vaccine production factors, it increased by 2.5%. Among the industries above designated size, the power and heat production and supply industries increased by 9.8%, the computer, communication and other electronic equipment manufacturing industries increased by 3.6%, the automobile manufacturing industry decreased by 2.6%, and the pharmaceutical manufacturing industry decreased by 58.3% (after excluding COVID-19’s vaccine production factors, it increased by 6.4%). The sales output value of industries above designated size reached 2,236.63 billion yuan, down 5.7%. Among them, the domestic output value was 2,056.05 billion yuan, down by 1.8%; Export delivery value reached 180.58 billion yuan, down 35.0%.
Construction industry: The total output value of general contracting and professional contracting construction enterprises with qualification grade in the whole year was 1,386.61 billion yuan, down 0.9% from the previous year. Among them, 379.07 billion yuan was completed in this city, an increase of 4.8%; 1,007.54 billion yuan was completed in other provinces, down 2.8%. The amount of newly signed contracts this year was 2,038.12 billion yuan, an increase of 1.9%.
Iv. transportation, post and telecommunications
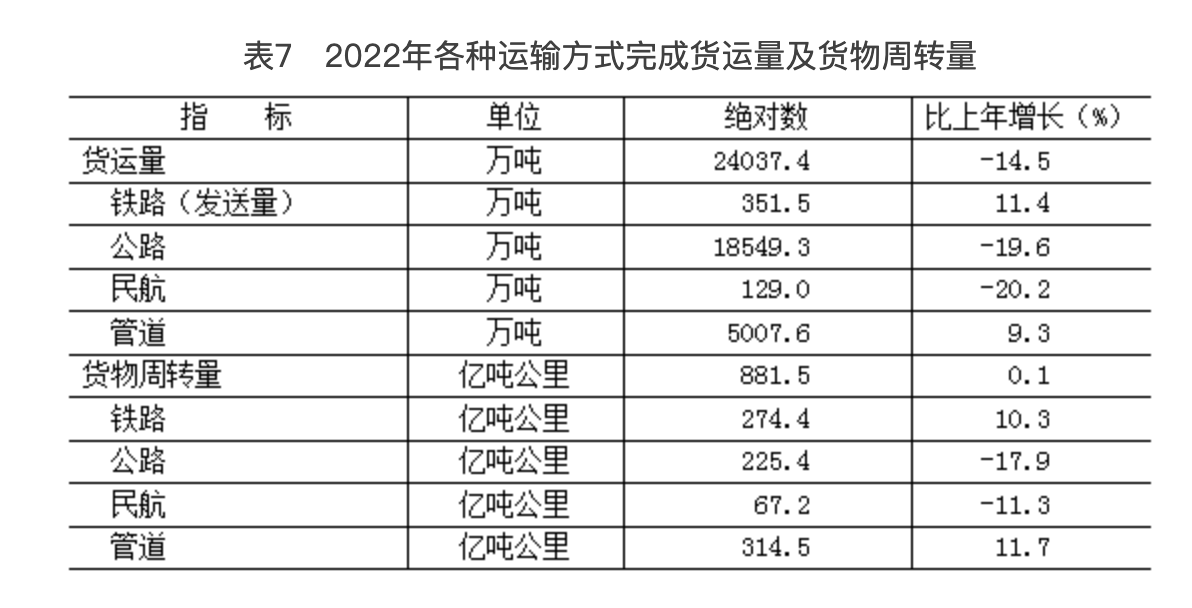
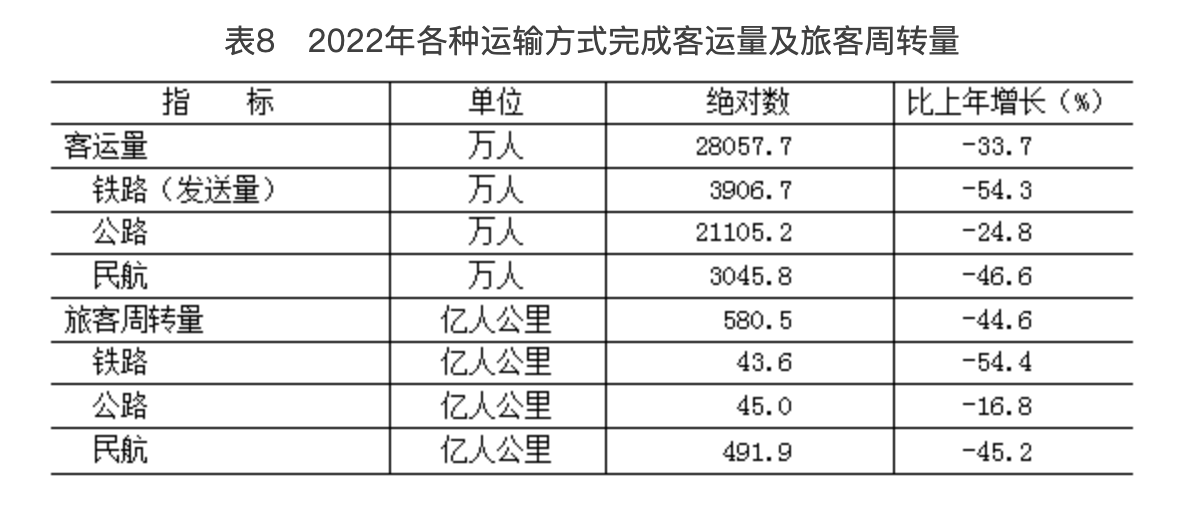
Transportation: the annual freight volume was 240.374 million tons, down 14.5% from the previous year; The cargo turnover was 88.15 billion tons kilometers, up by 0.1%. The annual passenger traffic was 280.577 million, down by 33.7%; Passenger turnover was 58.05 billion person-kilometers, down by 44.6%.
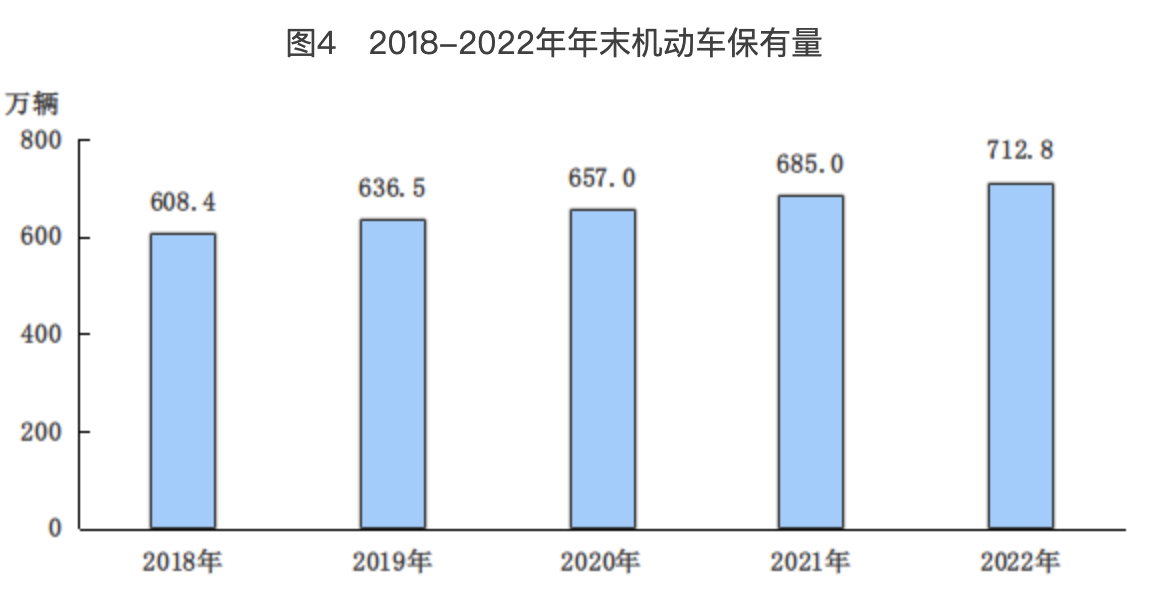
At the end of the year, the number of motor vehicles in the city was 7.128 million, an increase of 278,000 over the end of last year. There were 6.256 million civilian vehicles, an increase of 113,000. Among them, there were 5.326 million private cars, an increase of 114,000; There are 2.906 million cars in private cars.
Postal and Telecommunications: The total business volume of the postal industry was 28.14 billion yuan, which was 0.5% lower than that of the previous year at comparable prices. The postal industry completed 110 million postal letters and 1.96 billion express delivery services. In 2001, the total telecommunications business was 55.86 billion yuan, an increase of 22.6% at comparable prices. At the end of the year, there were 298,000 mobile phone base stations, including 151,000 4G base stations and 76,000 5G base stations, with 24,000 more than the previous year. At the end of the year, the number of mobile phone users was 39.269 million, and the penetration rate of mobile phones was 179.8 per 100 people. At the end of the year, the number of fixed Internet broadband access users reached 8.773 million, an increase of 8.8%; Mobile Internet access traffic reached 5.84 billion GB, up by 14.6%.
V. Finance and finance
Fiscal revenue and expenditure: the general public budget revenue was 571.44 billion yuan in the whole year, with an increase of 2.6% in the same caliber after deducting the tax refund factor. Among them, the value-added tax was 131.50 billion yuan, which decreased by 2.7% after deducting the tax refund factor; Enterprise income tax was 144.93 billion yuan, up by 3.9%; Personal income tax was 78.46 billion yuan, an increase of 5.6%. The city’s general public budget expenditure was 746.92 billion yuan, an increase of 3.7%. The national tax reduction and fee reduction policy was fully implemented, and the accumulated tax reduction and fee reduction and tax refund deferred fee exceeded 200 billion yuan throughout the year.
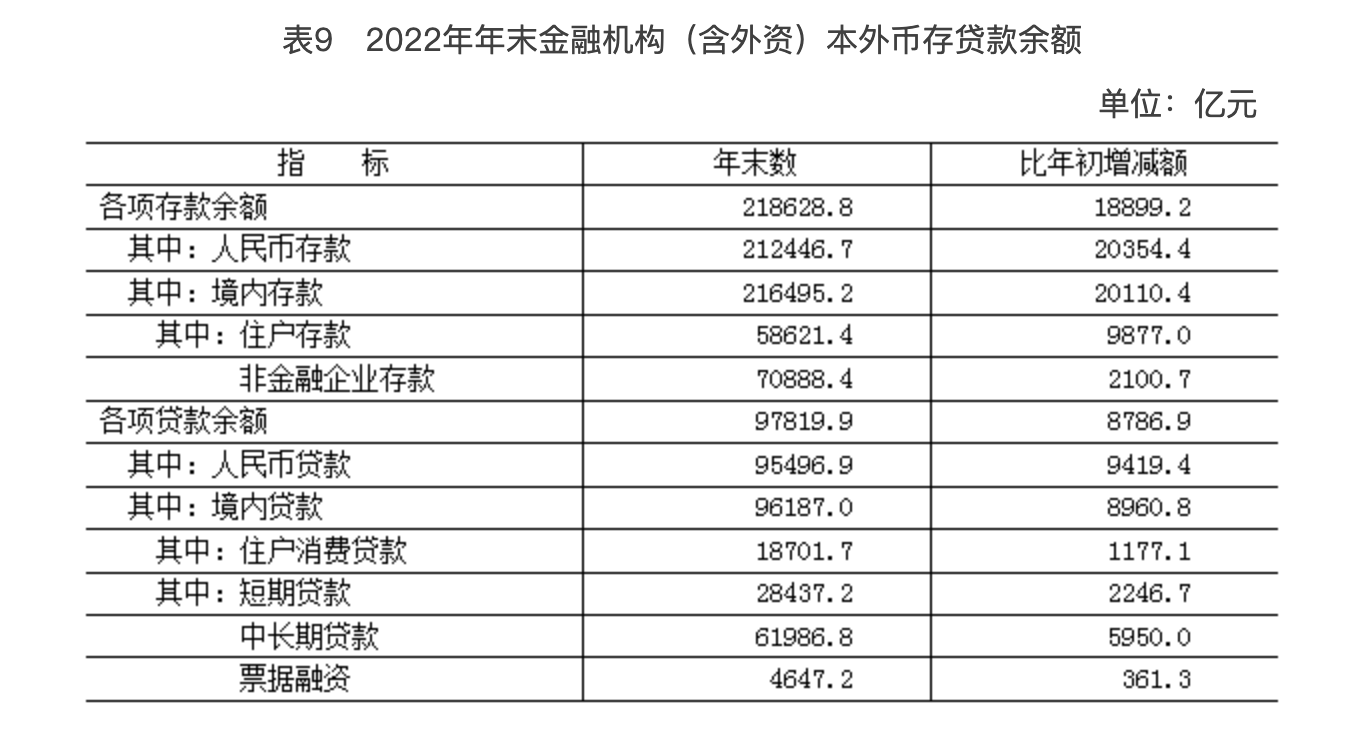
Deposits and loans: At the end of the year, the balance of local and foreign currency deposits of financial institutions (including foreign capital) in the city was 21,862.88 billion yuan, an increase of 1,889.92 billion yuan over the beginning of the year. The balance of local and foreign currency loans of financial institutions (including foreign capital) in the city was 9,781.99 billion yuan, an increase of 878.69 billion yuan over the beginning of the year.
Securities: The annual securities transaction volume was 184.6 trillion yuan, up by 2.5% over the previous year. Among them, the stock trading volume was 40.2 trillion yuan, down 6.4%; The fund transaction volume was 7.0 trillion yuan, an increase of 50.7%; The transaction volume of bonds was 137.3 trillion yuan, up by 10.5%. At the end of the year, the Beijing Stock Exchange (hereinafter referred to as the North Stock Exchange) had 162 listed companies, 80 more than the previous year; It has a total share capital of 21.35 billion shares, an increase of 70.1%; Companies listed on the North Stock Exchange issued 1.80 billion shares (including 1.75 billion publicly issued shares), an increase of 1.2 times; The amount of financing reached 16.70 billion yuan (including 16.38 billion yuan in public offering), an increase of 1.2 times.
Insurance: The original insurance premium income was 275.85 billion yuan, an increase of 9.2% over the previous year. Among them, property insurance premium income was 47.91 billion yuan, and personal insurance premium income was 227.94 billion yuan. The annual expenditure on various insurance claims was 77.60 billion yuan, down by 7.5%. Among them, property insurance paid 28.01 billion yuan and personal insurance paid 49.59 billion yuan.
VI. Investment in fixed assets and real estate development
Investment in fixed assets: investment in fixed assets (excluding farmers) increased by 3.6% over the previous year. Among them, infrastructure investment increased by 5.2% and private investment decreased by 6.1%. In terms of industries, investment in the primary industry increased by 11.6%; Investment in the secondary industry increased by 20.5%, of which the manufacturing industry increased by 18.4%; Investment in the tertiary industry increased by 1.7%, including scientific research and technical services by 60.7%, financial services by 41.3%, information transmission, software and information technology services by 36.0%, leasing and business services by 31.0%, education by 13.0% and health and social work by 10.9%.
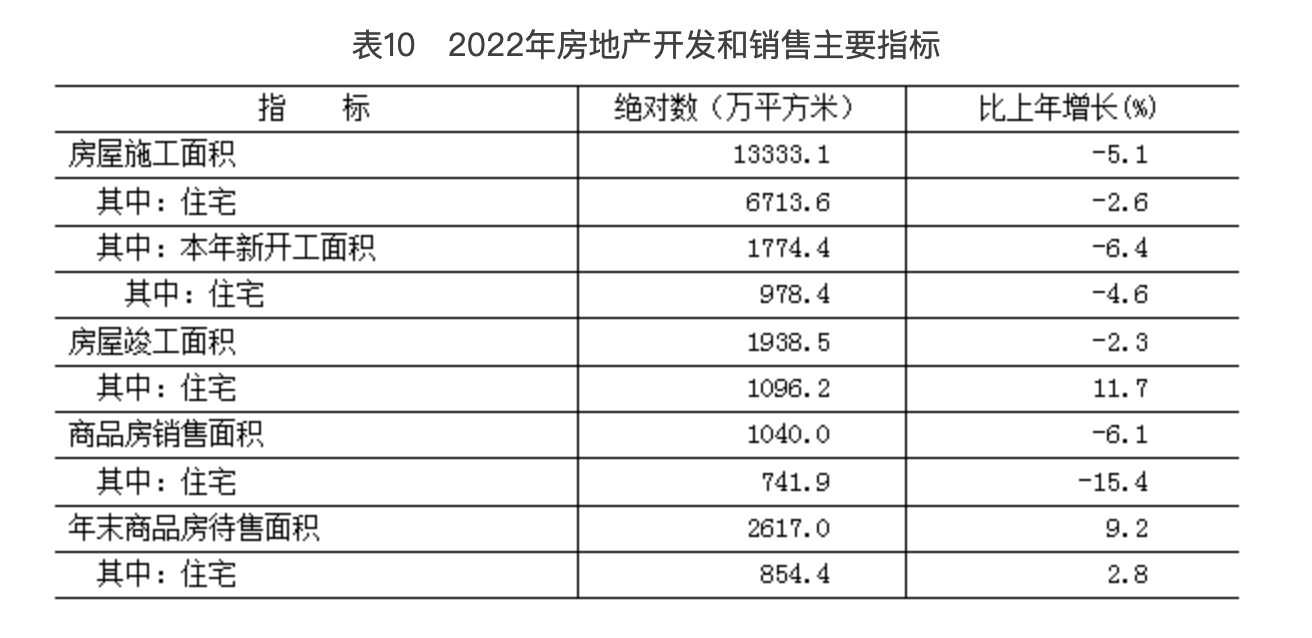
Real estate development: the investment in real estate development increased by 1.0% over the previous year. Among them, investment in residential buildings increased by 5.8%, investment in office buildings decreased by 22.5%, and investment in commercial buildings increased by 15.7%. The city’s housing construction area was 133.331 million square meters, down 5.1% from the previous year. Among them, the newly started area this year was 17.744 million square meters, down 6.4%. The completed housing area was 19.385 million square meters, down by 2.3%.
VII. Market consumption
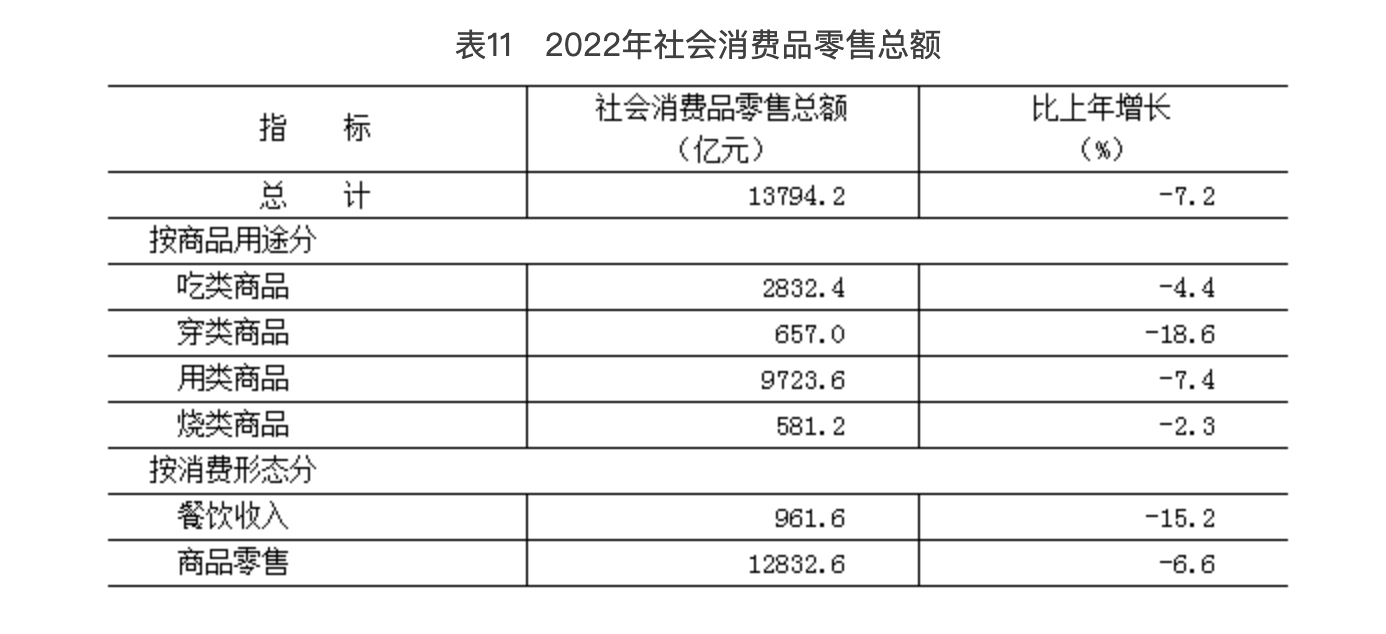
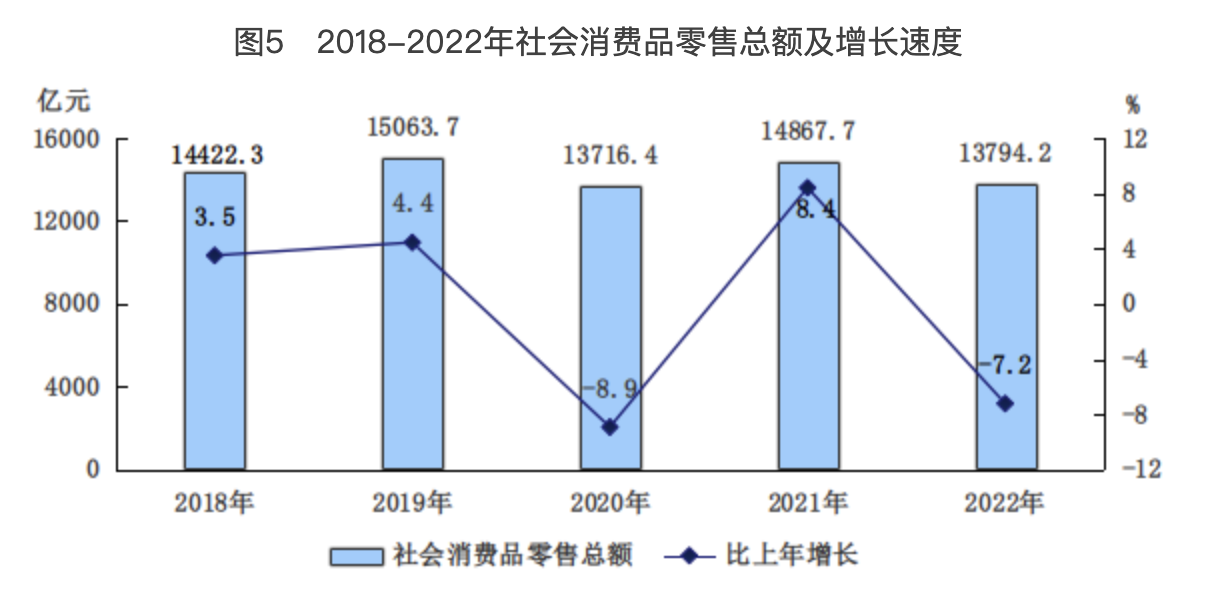
The total market consumption in the whole year decreased by 4.9% compared with the previous year. Among them, service consumption decreased by 2.9%; The total retail sales of social consumer goods reached 1,379.42 billion yuan, down by 7.2%. In the wholesale and retail industries above designated size, the retail sales of grain, oil, food and beverages related to basic consumption increased by 6.0% and 2.4% respectively, while the retail sales of gold, silver, jewelry and cultural office supplies related to upgrading consumption increased by 10.6% and 0.6% respectively. Driven by policies such as replacement subsidies for new energy vehicles, the retail sales of new energy vehicles increased by 17.1%.
VIII. Foreign Economy
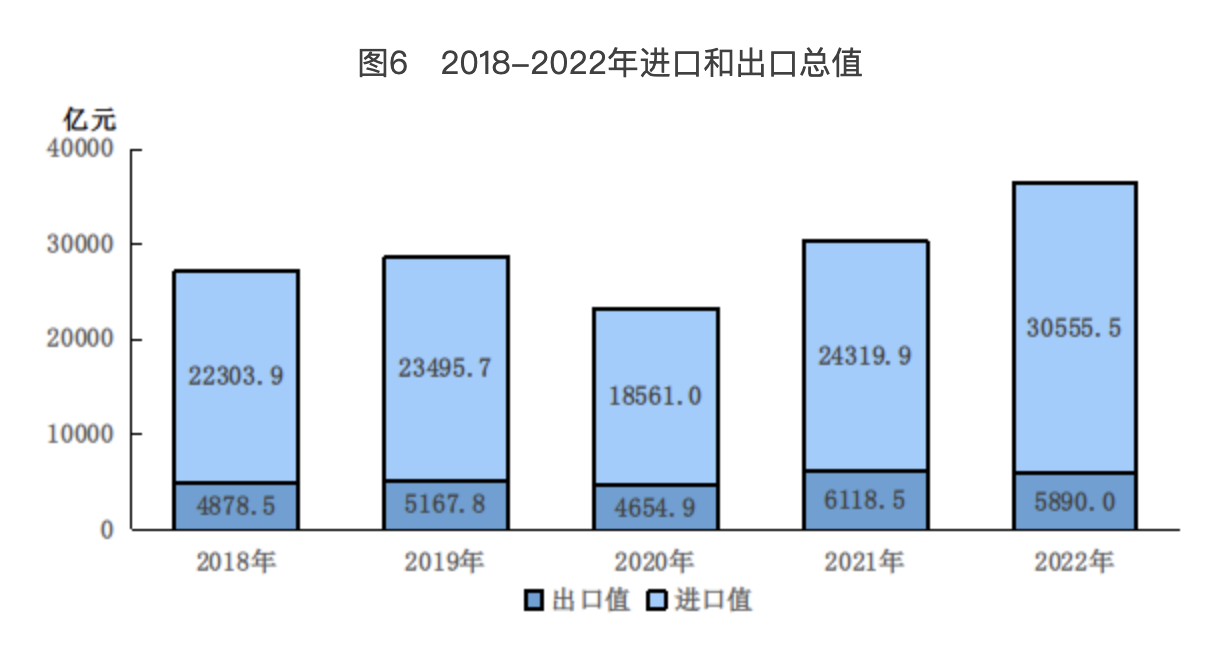
The total import and export value of Beijing in the whole year was 3,644.55 billion yuan, an increase of 19.7% over the previous year. Among them, imports were 3,055.55 billion yuan, an increase of 25.7%; Exports reached 589 billion yuan, down 3.8%.
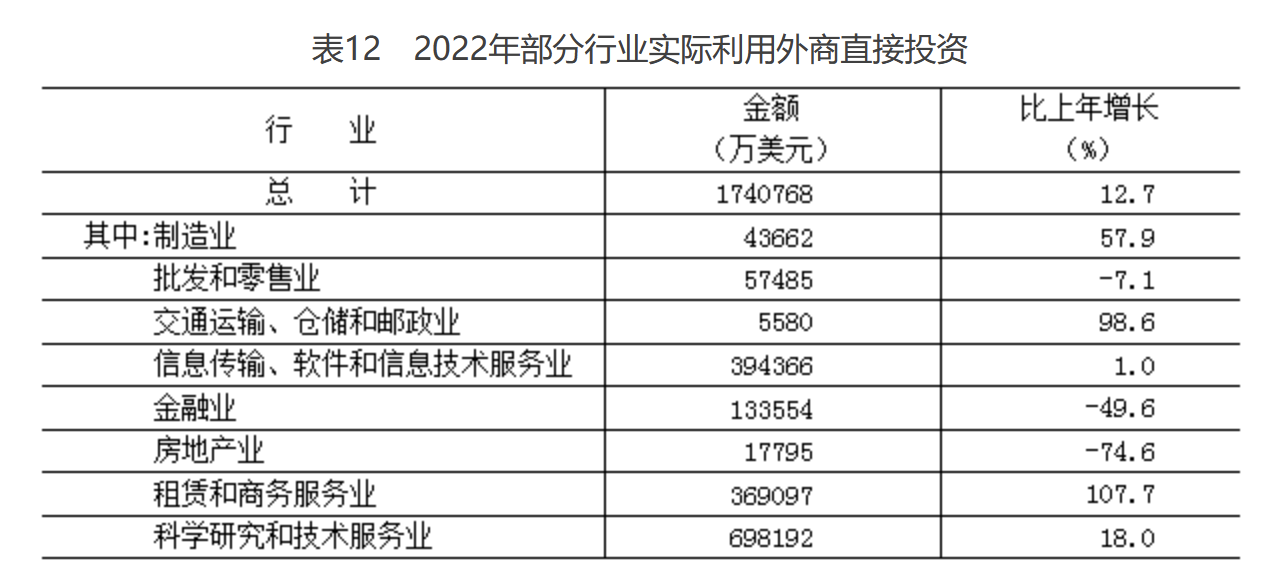
The actual utilization of foreign direct investment in the whole year was 17.41 billion US dollars, an increase of 12.7% over the previous year in terms of comparable caliber. Among them, scientific research and technical services amounted to US$ 6.98 billion, accounting for 40.1%, an increase of 18.0%; Information transmission, software and information technology services amounted to $3.94 billion, accounting for 22.7%, an increase of 1.0%; The leasing and business services industry was US$ 3.69 billion, accounting for 21.2%, an increase of 1.1 times.
The annual foreign direct investment amounted to 6.93 billion US dollars, an increase of 5.3% over the previous year. The turnover of foreign contracted projects was US$ 5.32 billion, up by 44.5%. Foreign labor cooperation sent 36,000 laborers of various types, and the actual income of laborers totaled 500 million US dollars.
IX. Urban Construction and Safe Production
Road construction: At the end of the year, the city’s highway mileage was 22,362.8 kilometers, an increase of 42.9 kilometers over the end of last year. Among them, the expressway mileage was 1,196.3 kilometers, an increase of 19.8 kilometers. At the end of the year, the mileage of urban roads was 6,208.8 kilometers, an increase of 41.3 kilometers over the end of last year.
Public transportation: At the end of the year, there were 1,291 bus and tram lines, an increase of 74 lines over the end of the previous year; The length of the operating line is 30173.9 kilometers, an increase of 1594.2 kilometers; 23,465 vehicles were operated, an increase of 386 vehicles; The total passenger traffic in the whole year was 1.73 billion passengers, down by 24.9%.
At the end of the year, there were 27 rail transit lines, which was the same as the end of last year; The length of the operating line is 797.3 kilometers, an increase of 14.3 kilometers; 7274 vehicles were operated, an increase of 164 vehicles; The total passenger traffic in the whole year was 2.26 billion passengers, down by 26.8%.
Public utilities: the annual sales volume of tap water was 1.283 billion cubic meters, up by 5.7% over the previous year. Among them, the industrial and construction industry was 111 million cubic meters, up by 1.3%; The service industry was 432 million cubic meters, down by 1.4%; 713 million cubic meters of households, an increase of 11.2%.
The annual electricity consumption in Beijing was 128.08 billion kWh, an increase of 3.9% over the previous year. Among them, the production electricity consumption was 95.99 billion kWh, an increase of 1.4%; The domestic electricity consumption of urban and rural residents was 32.09 billion kWh, up by 12.1%.
The total supply of natural gas in the whole year was 19.91 billion cubic meters, an increase of 4.4% over the previous year; The total supply of liquefied petroleum gas was 459,000 tons, an increase of 7.0%. At the end of the year, there were 9.63 million gas household users, an increase of 1.3%; Among them, 7.501 million households used natural gas, an increase of 1.7%. At the end of the year, the length of gas pipeline was 31,596 kilometers, an increase of 1.1%.
The central heating area of more than 100,000 square meters was 706 million square meters, an increase of 3.3% over the previous year.
Safety in production: There were 381 accidents in industrial, mining and commercial production, road traffic accidents in production and operation, fire accidents in production and operation, railway traffic accidents, agricultural machinery, special equipment and civil aircraft accidents, with 401 deaths, down by 12.8% and 14.9% respectively over the previous year. The death toll of production safety accidents in the region with a GDP of 10 billion yuan was 0.9637.
X. People’s Life and Social Security
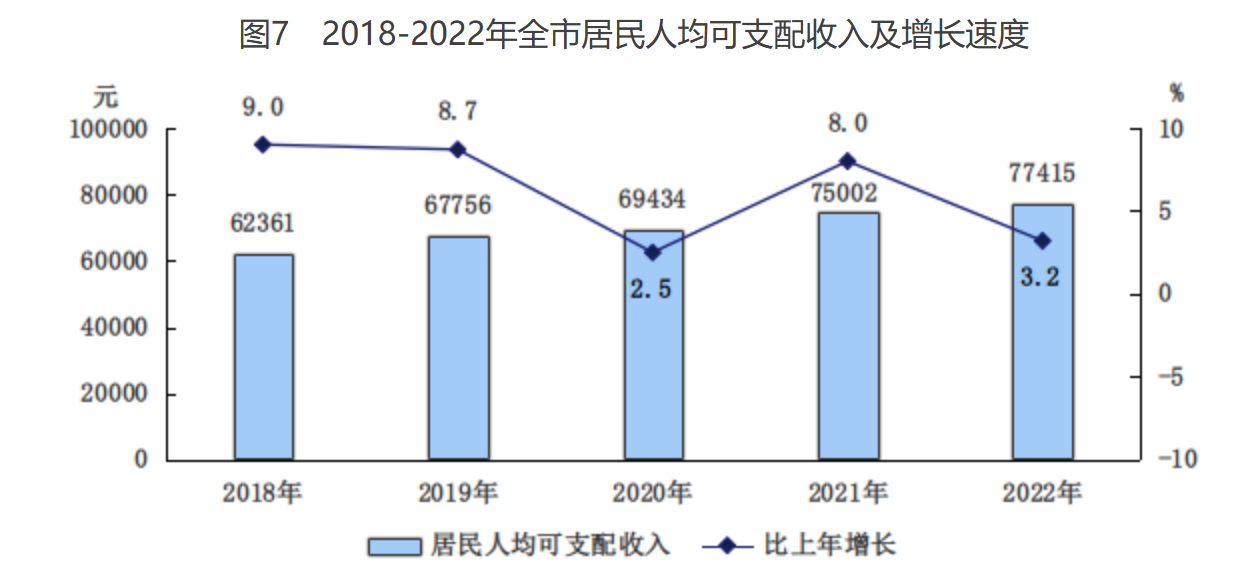
People’s life: the per capita disposable income of the city’s residents in the whole year was 77,415 yuan, an increase of 3.2% over the previous year, with a real increase of 1.4% after deducting the price factor. Among them, the per capita disposable income of urban residents was 84,023 yuan, an increase of 3.1%; The per capita disposable income of rural residents was 34,754 yuan, an increase of 4.4%. From the four income components, the per capita wage income of residents in the city was 47,758 yuan, an increase of 4.6%; The per capita net operating income was 903 yuan, down 3.9%; The per capita net income of property was 12,418 yuan, down by 0.3%; The per capita net transfer income was 16,336 yuan, an increase of 2.6%.
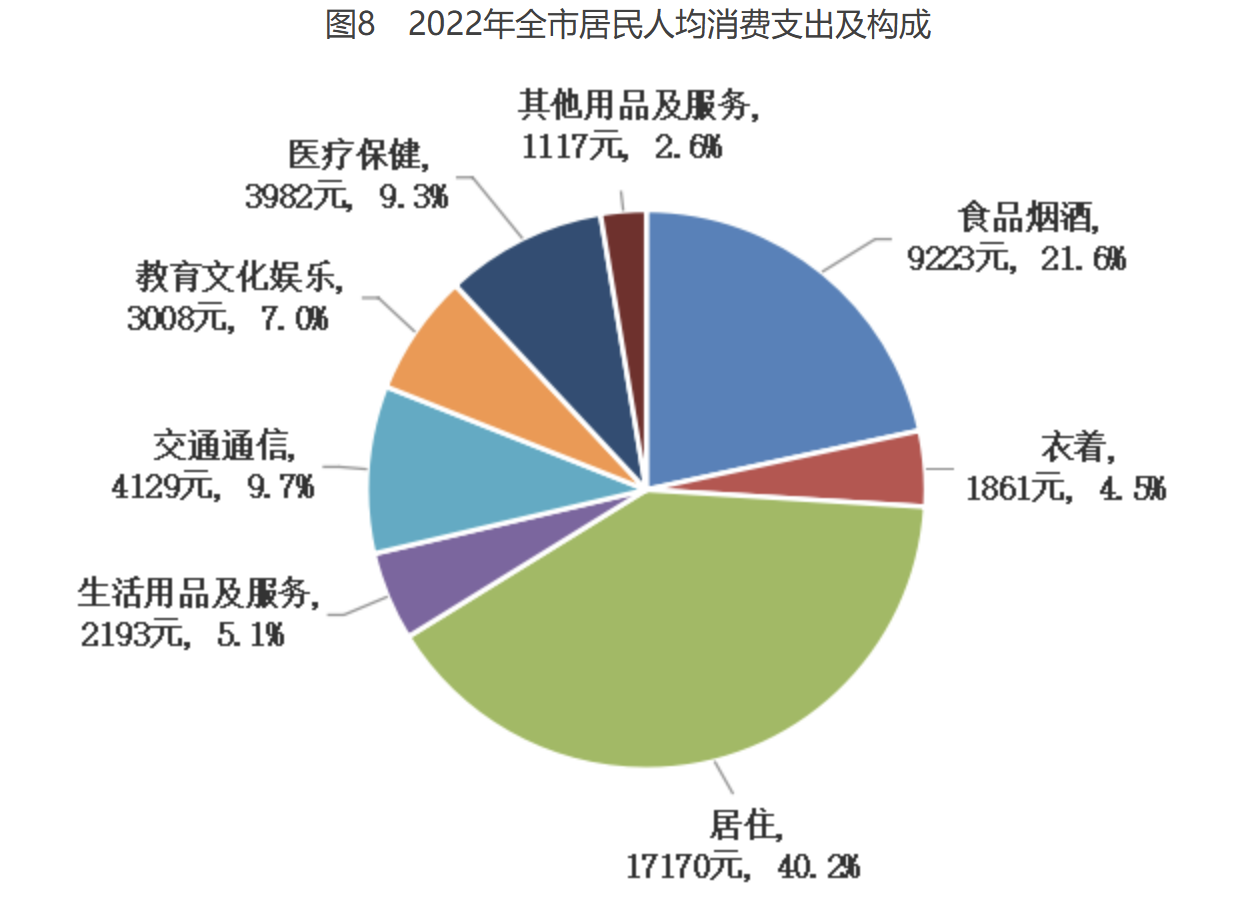
In the whole year, the per capita consumption expenditure of residents in the city was 42,683 yuan, down 2.2% from the previous year. Among them, the per capita consumption expenditure of urban residents was 45,617 yuan, down by 2.5%; The per capita consumption expenditure of rural residents was 23,745 yuan, an increase of 0.7%. The Engel’s coefficient of the city’s residents is 21.6%, including 21.1% for urban residents and 27.4% for rural residents.
Social security: At the end of the year, the number of people who participated in basic pension for enterprise employees, basic medical care for urban employees, unemployment insurance, industrial injury insurance and maternity insurance was 17.642 million, 14.962 million, 13.914 million, 13.378 million and 10.866 million, respectively, up by 2.3%, 0.7%, 2.4%, 2.3% and 0.4% compared with the end of the previous year.
At the end of the year, 1.876 million people participated in the old-age security for urban and rural residents, and 4.044 million people participated in the basic medical insurance for urban and rural residents.
At the end of the year, 70,000 people enjoyed the minimum living guarantee for urban residents and 37,000 people enjoyed the minimum living guarantee for rural residents.

At the end of the year, there were 612 civil affairs service organizations providing accommodation, with 117,800 beds and 44,000 people in the hospital.
XI. Education, science and technology, cultural tourism, health and sports
Education: 146,000 graduate students were enrolled, 435,000 were studying and 114,000 were graduating. Colleges and universities recruit 166,000 students, including 603,000 students and 154,000 graduates. There are 30,000 students enrolled in the adult college, 78,000 students and 39,000 graduates.
In the whole year, 75,000 ordinary high schools enrolled students, 199,000 students and 50,000 graduates. Ordinary junior high schools enrolled 121,000 students, 356,000 students and 104,000 graduates. Ordinary primary schools enrolled 190,000 students, 1.084 million students and 133,000 graduates. There are 179,000 children in kindergartens and 574,000 children in kindergartens. All kinds of secondary vocational education (excluding technical schools) enrolled 20,000 students, 55,000 students and 13,000 graduates. There are 1,110 special education students, 7,722 students and 1,666 graduates.
There were 15 private colleges and universities with 54,000 students. There are 124 private secondary education schools with 26,000 students. There are 41 private primary schools with 38,000 students. There are 1,037 private kindergartens with 245,000 children.
Science and technology: The number of patents granted in 2003,000, an increase of 2.0% over the previous year. Among them, the number of invention patents granted was 88,000, an increase of 11.3%. By the end of the year, there were 478,000 valid invention patents, an increase of 18.0%. The number of PCT international patent applications was 11,463, an increase of 10.7%. The number of high-value invention patents per 10,000 population was 112.0, an increase of 17.8 over the previous year. In the whole year, 95,061 technical contracts were registered, an increase of 1.6%; The turnover of technology contracts was 794.75 billion yuan, up by 13.4%.
Culture: At the end of the year, there were 21 public libraries with a total circulation of 7.695 million people. There are 18 national archives with 10.495 million volumes of paper files; There are 210 registered museums, of which 100 are open for free; There are 18 mass art museums and cultural centers. There are 3,514 kinds of newspapers and periodicals registered in Beijing, including 240 publishing houses and 10,419 publishing units. In 2001, 7,446 publications were copyrighted and 1,054,000 were registered. At the end of the year, there were 6.101 million cable TV users, including 3.442 million HDTV users and 1.937 million Ultra HD (4K) users. In the whole year, 36 TV series with 1260 episodes, 20 TV cartoons with 4351 minutes, 150 documentaries, 58 online dramas, 98 online movies, 43 online miniseries and 28 online cartoons were produced. In 2001, 135 films were produced, with a total of 292 cinemas in 30 cinemas, showing 2.629 million films, with an audience of 25.754 million and a box office income of 1.42 billion yuan.
Tourism: the total number of tourists received in the whole year was 180 million, a decrease of 28.5% over the previous year; The total tourism revenue reached 252.03 billion yuan, down 39.5%. Among them, 180 million domestic tourists were received, down by 28.6%, and the total domestic tourism revenue was 249.09 billion yuan, down by 39.8%; The number of inbound tourists received was 241,000, down by 1.6%, and the foreign exchange income from international tourism was 440 million US dollars, up by 2.3%.
Health: At the end of the year, there were 12,211 medical and health institutions, an increase of 484 over the end of last year. Among them, there are 741 hospitals. There are 134,000 beds in medical institutions, an increase of 4,000 beds. Among them, there are 126,000 hospital beds. There are 322,000 health technicians. Among them, there are 125,000 practicing (assistant) doctors and 143,000 registered nurses. The total number of medical consultations in medical institutions was 231.024 million.
Sports: Beijing athletes won 53 medals in international competitions, including 36 gold medals and 10 silver medals. Won 197 medals in national competitions, including 62 gold medals and 66 silver medals. At the 24th Winter Olympics in Beijing, 34 athletes and 3 coaches were selected by the China Sports Delegation, participated in 17 events in 7 disciplines and 5 major events, and won 2 gold medals and 1 silver medal. In the whole year, Beijing disabled athletes won 9 medals in international competitions. At the 13th Beijing Paralympic Winter Games, a total of 12 athletes and 3 coaches were selected by the China Sports Delegation to participate in five major events except Paralympic Ice Hockey, and won five gold medals, two silver medals and two bronze medals.
XII. Resources and Urban Environment
Land supply: the total supply of construction land in the whole city was 3251 hectares. Among them, 1007 hectares of construction land for special water supply, 717 hectares of land for public management and public service, 1169 hectares of residential land supply and 358 hectares of industrial land supply.
Water resources: the total water resources in the whole year was 2.567 billion cubic meters. At the end of the year, the total storage capacity of large and medium-sized reservoirs was 3.814 billion cubic meters, a decrease of 496 million cubic meters from the end of the previous year. At the end of the year, the buried depth of groundwater in the plain area was 15.64 meters, up 0.75 meters from the end of last year. The total production and domestic water consumption in the whole year was 2.456 billion cubic meters, down by 1.7%. Among them, domestic water (including service industry and household water) was 1.62 billion cubic meters, down by 0.2%; Industrial water consumption was 229 million cubic meters, down by 2.4%; Agricultural water consumption was 261 million cubic meters, down by 7.4%.
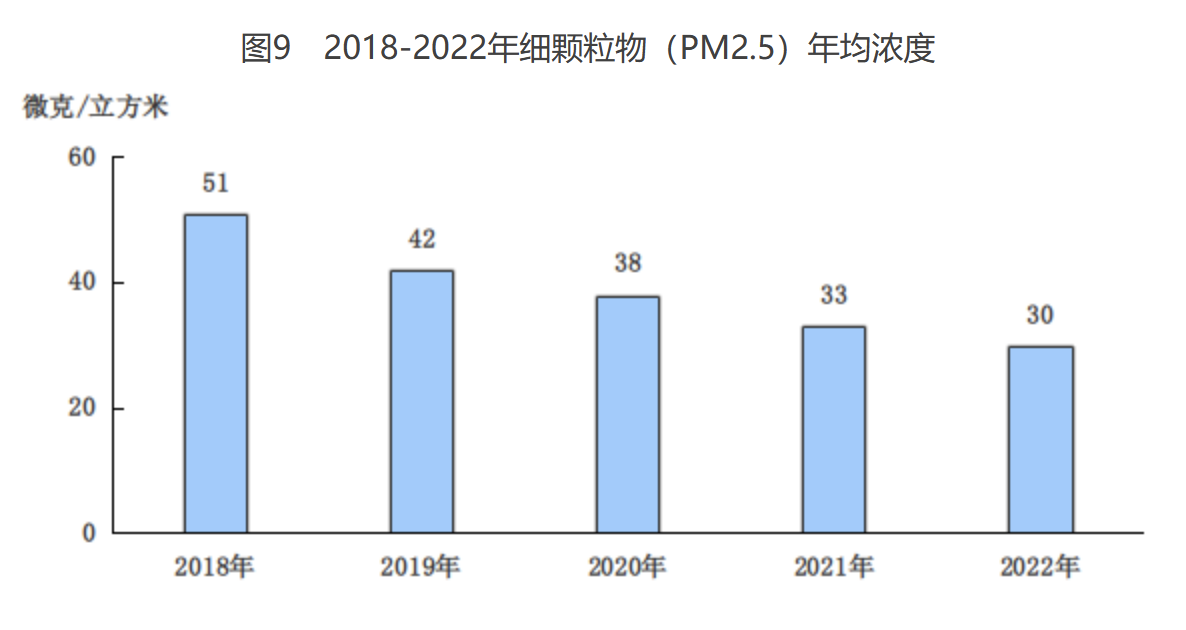
Urban environment: the sewage treatment rate in the whole year was 97.0%, and the sewage treatment rate in the six districts of the city reached 99.7%, up by 1.2 and 0.2 percentage points respectively over the previous year. The city cleared and disposed of 7,405,700 tons of domestic garbage, with an average of 20,300 tons per day. Among them, 5,655,600 tons of other garbage, with an average of 15,500 tons per day; The kitchen waste is 1,750,100 tons, with an average of 0.48 million tons per day. There are 32 centralized domestic waste treatment facilities in the city, with an actual treatment capacity of 25,111 tons/day. The average annual concentrations of fine particulate matter (PM2.5), inhalable particulate matter (PM10) and nitrogen dioxide (NO2) were 30 μ g/m3, 54 μ g/m3 and 23 μ g/m3, respectively, which decreased by 9.1%, 1.8% and 11.5% respectively. The average annual concentration of sulfur dioxide (SO2) is 3 μ g/m3, which is the same as last year.
10,200 hectares of afforestation were added in the whole year. The forest coverage rate reached 44.8%, an increase of 0.2 percentage points over the previous year. The urban greening coverage rate was 49.3%, an increase of 0.01 percentage points. The city’s per capita park green area is 16.89 square meters, an increase of 0.27 square meters.
XIII. High-quality development results
Kinetic energy conversion: the added value of the digital economy in the whole year was 1,733.02 billion yuan, an increase of 4.4% over the previous year at current prices, accounting for 41.6% of the city’s regional GDP, an increase of 1.2 percentage points over the previous year; Among them, the added value of the core industries of the digital economy was 995.83 billion yuan, up 7.5%, accounting for 23.9% of the regional GDP, up 1.3 percentage points. The layout of cloud computing and artificial intelligence was accelerated, and the investment in fixed assets of new infrastructure projects increased by 25.5% throughout the year. The online retail sales of wholesale and retail businesses and accommodation and catering businesses above designated size reached 548.56 billion yuan, up by 0.4%. The opening up of key areas was accelerated. In the whole year, Beijing imported and exported 1.59 trillion yuan to countries along the Belt and Road, an increase of 28.2%, accounting for 43.7% of the total value of regional imports and exports. The actual utilization of foreign capital in key areas of service industry expansion and opening-up was US$ 15.86 billion, an increase of 20.6%, of which the proportion of science and technology, Internet information, business and tourism services exceeded 90%. From January to November, the research and development expenses of large and medium-sized key enterprises in the city increased by 10.0% year-on-year; The technology income of high-tech enterprises above designated size accounted for 21.7% of the total income in Zhongguancun Demonstration Zone, up 2.1 percentage points year-on-year.
Structural optimization: The added value of service industry accounted for more than 80% of the city’s regional GDP, among which the added value of information transmission, software and information technology services, finance, scientific research and technology services increased by 9.8%, 6.4% and 1.8% respectively, accounting for 45.9% of the regional GDP, up by 2.5 percentage points over the previous year. The production of some high-tech products maintained rapid growth, and the output of new energy vehicles, wind turbines and pneumatic components increased by 1.9 times, 45.6% and 36.5% respectively. The city’s investment in high-tech industries increased by 35.3%, accounting for 15.7% of the city’s investment in fixed assets, an increase of 3.7 percentage points over the previous year. Among them, investment in high-tech manufacturing industry increased by 28.3% driven by integrated circuit manufacturing and pharmaceutical manufacturing projects, and investment in high-tech service industry increased by 41.3% driven by Internet-related services.
Improve efficiency and reduce consumption: the comprehensive energy consumption of industrial enterprises above designated size in the city is 14.09 million tons of standard coal, down 2.5% from the previous year. The water consumption per 10,000 yuan GDP was 9.61 cubic meters, which was 2.71% lower at constant prices. The power generation of renewable energy sources such as biomass energy, hydropower, solar energy and wind energy increased by 1.2%, accounting for 10.9% of the total power generation, an increase of 0.2 percentage points over the previous year.
People’s livelihood security: among the general public budget expenditures in the whole year, the expenditures on education, social security, employment and health were 117.11 billion yuan, 106.78 billion yuan and 77.58 billion yuan respectively, accounting for 40.4% of the general public budget expenditures, up by 1.0 percentage point over the previous year. The proportion of infrastructure investment in transportation and public facilities management in the city is 42.3% and 21.1% respectively. In the supply of residential land in the whole year, 304 hectares of rental housing land were supplied through multiple channels, exceeding the annual plan.
Bulletin notes:
1. Data in 2022 are preliminary statistics. The calculation errors of some data totals or relative numbers caused by different units of measurement are not mechanically adjusted.
2. The third industry division is based on the Regulations on the Third Industry Division (Guo Tong Zi [2012] No.108) revised by the National Bureau of Statistics in 2018, and the industry division is based on the National Economic Industry Classification (GB/T4754-2017).
3. The data of permanent residents in 2022 are calculated from the sampling survey on population changes in 2022 organized by the national unity organization, and the standard survey time is 0: 00 on November 1, 2022.
4. Industrial enterprises above designated size refer to all industrial legal person enterprises with annual main business income of 20 million yuan or more.
5. The total business volume of the postal industry shall be subject to the constant price standard in 2020, and the growth rate shall be calculated according to the comparable caliber.
6. The total telecom business of telecom enterprises shall be subject to the constant price standard in 2021, and the growth rate shall be calculated according to the comparable caliber.
7. Wholesale and retail units above designated size refer to wholesale and retail units (including legal entities, industrial activity units and self-employed households) with annual main business income of 20 million yuan and above.
8. Since May 2022, according to the newly revised Statistical Investigation System of Foreign Investment of the Ministry of Commerce, the actual utilization of foreign direct investment is full-caliber data including banking, securities and insurance, and the growth rate is the same caliber growth rate excluding the above-mentioned fields.
9. The total supply of natural gas includes the supply of Yanshan Petrochemical.
10. Relevant data of health institutions and health technicians include data of troops stationed in Beijing and armed police hospitals, but the number of beds is excluded.
11. Special water construction land refers to special land, transportation land, water areas and water conservancy facilities.
12. The buried depth of groundwater in plain area refers to the distance from the surface of groundwater to the ground in plain area.
13. Accommodation and catering units above designated size refer to accommodation and catering units with annual main business income of 2 million yuan or more (including legal entities, industrial activity units and self-employed households).
Source:
The motor vehicle data in this bulletin comes from the Public Security Traffic Management Bureau of Beijing Public Security Bureau; The data of mobile phone base station comes from Beijing Communications Administration; Financial data comes from Beijing Municipal Bureau of Finance; Deposit and loan data come from the business management department of the People’s Bank of China; The data of securities transaction amount comes from the data of Shanghai Stock Exchange and Shenzhen Stock Exchange listed in Beijing. The data of Beijing Stock Exchange comes from official website of Beijing Stock Exchange; The insurance data comes from the Beijing Supervision Bureau of the Bank of China Insurance Regulatory Commission; Import and export data from People’s Republic of China (PRC) Beijing Customs; The data of actual utilization of foreign capital, overseas investment, foreign contracted projects and foreign labor cooperation come from Beijing Municipal Bureau of Commerce. The data of road construction and public transportation come from Beijing Municipal Transportation Commission. The data of tap water sales, water resources and sewage treatment come from Beijing Water Affairs Bureau. Power generation and electricity consumption data come from State Grid Beijing Electric Power Company; The data of liquefied petroleum gas and natural gas supply, gas household users, gas pipelines, central heating area and garbage disposal come from Beijing Urban Management Committee. Safety production data comes from Beijing Emergency Management Bureau; The data of medical insurance and maternity insurance come from Beijing Medical Security Bureau, and the rest of social security data and urban new employment data come from Beijing Human Resources and Social Security Bureau. The data of subsistence allowances and accommodation institutions come from Beijing Civil Affairs Bureau of Social Work Committee of Beijing Municipal Committee of the Communist Party of China; Education data comes from Beijing Municipal Education Commission; Patent data comes from Beijing Intellectual Property Office; Technical market data comes from Beijing Technical Market Management Office;Public libraries, cultural centers and tourism data come from Beijing Municipal Bureau of Culture and Tourism and National Library. Archives data comes from Beijing Archives Bureau; Museum data comes from Beijing Cultural Relics Bureau; The published data comes from Beijing Press and Publication Bureau; The TV data comes from Beijing Radio and Television Bureau; The film data comes from Beijing Film Bureau; Health data comes from Beijing Municipal Health and Wellness Committee; Athletes’ data comes from Beijing Sports Bureau; The data of disabled athletes come from Beijing Disabled Persons’ Federation; Construction land supply data comes from Beijing Municipal Planning and Natural Resources Commission; Air quality data comes from Beijing Municipal Bureau of Ecology and Environment; Afforestation and greening data come from Beijing Bureau of Landscaping and Greening; Other data come from Beijing Municipal Bureau of Statistics and Beijing Investigation Corps of National Bureau of Statistics.